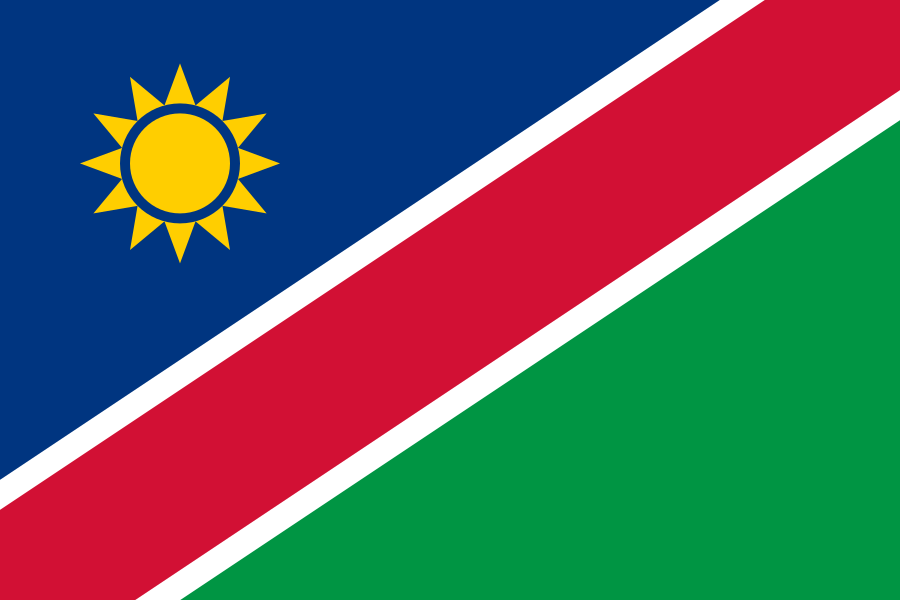
Namibia
Republic of Namibia
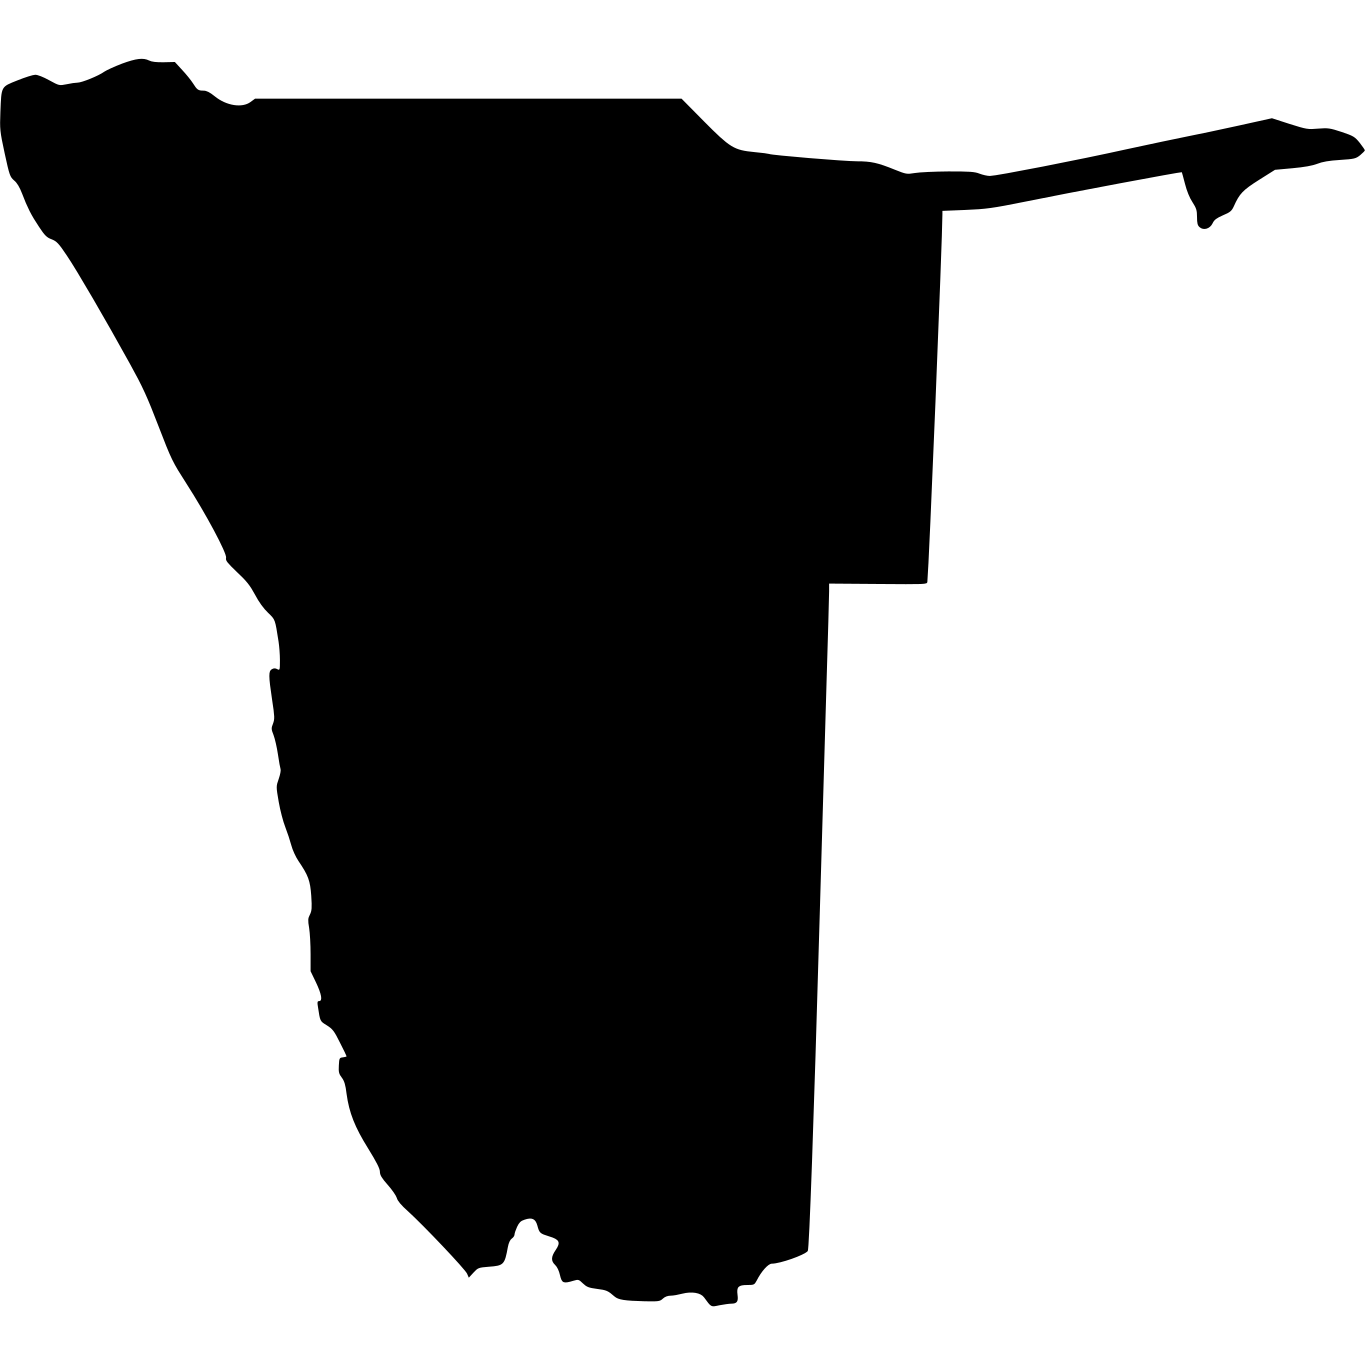
Namibia is a resource-rich, upper-middle-income country with one of Africa's highest GDP per capita levels. The economy is driven by mining (uranium, diamonds, zinc, gold), fishing, tourism, and agriculture. Namibia is the world's third-largest uranium producer.
The country is positioning itself as a global leader in green hydrogen, with the Hyphen Hydrogen Energy project (a $10 billion investment) planned for the Tsau Khaeb National Park. The Walvis Bay port is a key logistics hub for Southern African trade. Namibia benefits from its membership in SACU (common customs area with South Africa, Botswana, Lesotho, and Eswatini) and has the Namibian dollar pegged at par to the South African rand.
Namibia's New Equitable Economic Empowerment Framework (NEEEF) aims to promote economic inclusion. Challenges include high inequality (one of the world's highest Gini coefficients), unemployment above 33%, and a small domestic market.
Snapshot
World Bank Indicators Compare with another country
Climate Readiness Full ranking
How this is computed
Adaptive capacity to absorb climate finance and adapt, following the readiness dimension of the ND-GAIN framework. Built only from measured values already held on each country profile. It is not a measure of emissions or physical climate vulnerability, which the platform does not yet hold.
- Energy access (30%) — World Bank, access to electricity (% of population). The single most climate and energy specific signal held: SDG 7 and the clean-energy transition.
- Governance readiness (20%) — Transparency International, Corruption Perceptions Index (0-100). ND-GAIN governance readiness: the capacity to govern and deploy climate finance. Higher is cleaner.
- Human readiness (20%) — UNDP, Human Development Index (0-1). ND-GAIN social readiness: the adaptive capacity of the population.
- Economic readiness (15%) — World Bank, GDP per capita (current US$), latest measured year. ND-GAIN economic readiness: the capacity to finance adaptation. Scored relative to the covered set.
- Digital readiness (15%) — World Bank, individuals using the Internet (% of population). Information systems for early warning and adaptation.
A country is scored only when at least 4 of the five indicators are held. Sub-scores are weighted and renormalised over the indicators that are present; nothing is estimated for one that is absent.
Country Facts
Focus Sectors
Regulations & Taxes
Business Directory (103)
View AllNamibia Chamber of Commerce and Industry
Non-profitPrivate sector apex body
African Stars FC
Non-profitMost successful Namibian club
Namibia Football Association
Non-profitThe Brave Warriors
Windhoek Central Hospital
Non-profitNational referral hospital
International University of Management Namibia
Non-profitPrivate management university
Namibia University of Science and Technology
Non-profitScience and technology university
University of Namibia
Non-profitNamibia's oldest university since 1992
Erongo Desalination Plant
CorporateDesalination infrastructure
Namibia Industrial Development Agency
Non-profitIndustrial development
Namibia Development Corporation
Non-profitState development corporation
NamibRe
CorporateNational reinsurer
Hyphen Hydrogen Energy
Corporate$10bn green hydrogen project
Tenders
View AllContract Awards
View AllProcurement of: Consultancy Services for the Provision of an Environmental and Social Impact Assessment (ESIA) for NamPower Wind Project, Including the Transmission Line, in the Tsau //Khaeb park
Government of Namibia (World Bank-financed, project P179377)
Procurement of Consultancy for Wind Resource Assessment
Government of Namibia (World Bank-financed, project P179377)
Provision of Consultancy Services for Technical Advisory and Project Management Services (Owner’s Engineer) for the Lithops BESS Project
Government of Namibia (World Bank-financed, project P177328)